





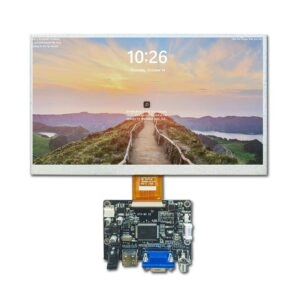
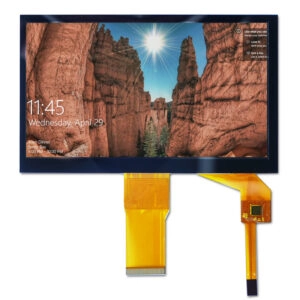





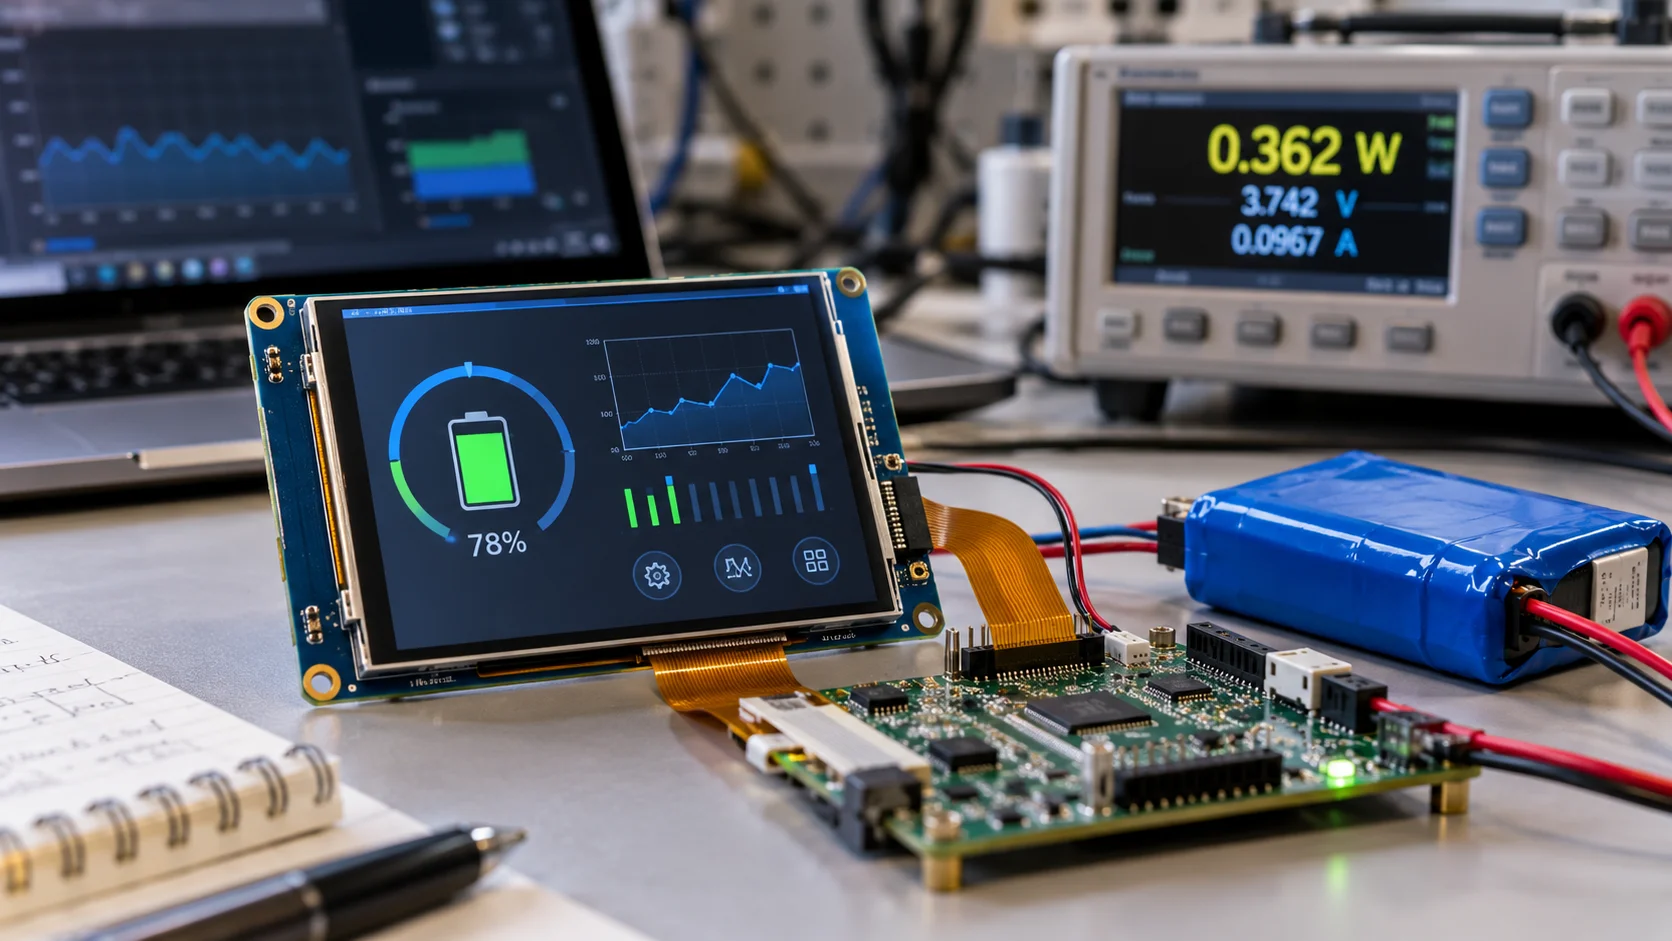
Battery life is rarely determined by the TFT LCD interface name alone. Separate logic power, interface activity, backlight demand, auxiliary circuits, and conversion losses. A static page, periodic data view, and full-screen animation create different loads, so calculate the module’s real operating states and validate them with the planned brightness, timing, and update pattern.
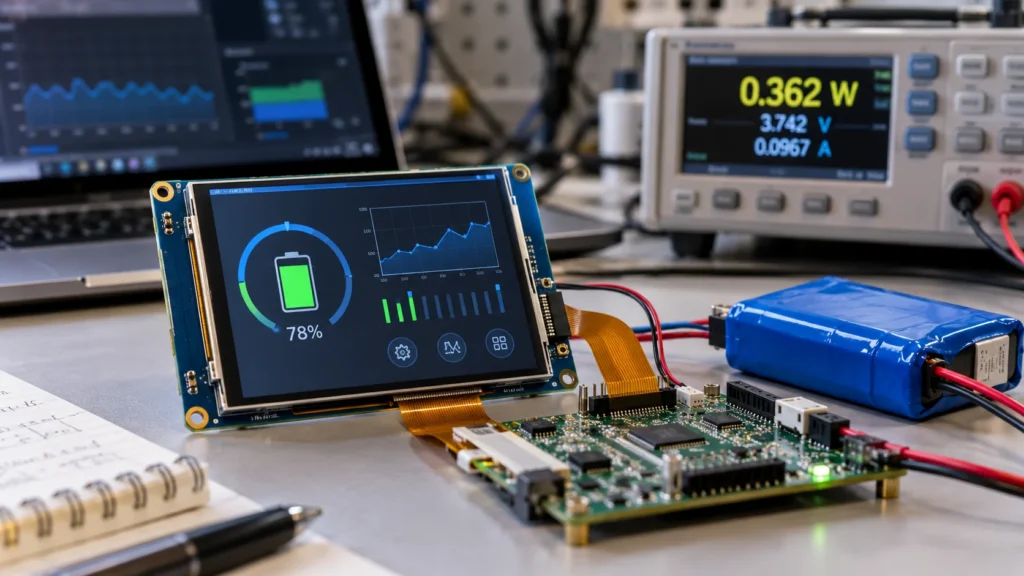
Define the Power Boundary Before Choosing an Interface
First decide what “display power” includes. Record these loads separately:
- LCD logic and driver circuitry
- Interface activity between the host and the module
- Backlight and its control circuit
- Touch controller or other auxiliary functions, when fitted
- Regulators, level shifters, bridges, or cables that draw energy from the battery side
The interface label describes signaling, not a complete budget. A serial link may allow burst transfers, while a parallel or video-style link may keep more signals active. Panel electronics and the backlight can outweigh that difference, so compare energy per useful update rather than interface names.
For background on the electrical choices, see Miqidisplay’s TFT LCD interface selection guide. This article applies that information to a narrower question: how much energy will the display path consume in the intended battery-powered product?
Build the Estimate from Datasheet Inputs
Collect voltage, current, start-up duration, standby and sleep behavior, backlight control, refresh range, and initialization for every rail and mode. A TFT LCD module datasheet review can organize these fields, but typical values are not guaranteed limits.
For each rail, calculate:
Prail = Vrail × Irail
If the load changes during a cycle, calculate the time-weighted average:
Pavg = (P1 × t1 + P2 × t2 + … + Pn × tn) / T
For a switching regulator, estimate battery-side input power as:
Pbattery ≈ Pdisplay / η
Here, η is conversion efficiency at the relevant load. If battery voltage changes substantially, repeat the calculation at the beginning and end of the discharge range. A runtime estimate based on nominal voltage and one typical current can be misleading.
Treat the backlight as its own budget. If a driver specifies controlled current and duty cycle, a first approximation is:
Pbacklight ≈ Vbacklight × Ibacklight × duty cycle
Adjust this value for driver losses and confirm the result at the intended brightness with a sample.
Translate Screen Updates into Interface Activity
The interface contributes through data movement, clocking, PHY or driver circuitry, and host active time. Estimate that workload before assigning current.
For a full-frame update:
Bytes per frame = horizontal pixels × vertical pixels × bits per pixel / 8
Multiply by planned full-frame updates per second, then add blanking, command, packet, or protocol overhead where applicable. A 320 × 480 image at 16 bits per pixel contains 307,200 bytes before overhead. Sending it 10 times per second differs greatly from sending a small status region every few seconds.
Use the result to estimate transfer time and duty cycle, but do not equate data rate with module power. Host voltage, bus frequency, DMA, buffering, and idle-state support can change energy use.
| Interface behavior | What to include in the estimate |
| SPI or serial MCU bursts | Bytes, bus frequency, command overhead, host active time, and idle current |
| MCU parallel bursts | Bus width, line toggling, transfer duration, driver losses, and host active time |
| RGB-style continuous timing | Pixel clock, refresh timing, synchronization, display-engine load, and unchanged-image behavior |
| MIPI DSI or LVDS serial links | Lane or channel count, high-speed versus low-power periods, PHY or bridge rails, and idle state |
There is no universal “lowest-power interface.” A low-pin-count link may transfer longer; a high-throughput link may finish quickly but add PHY power. Compare energy per useful update under the actual duty cycle.
Model Active, Idle, and Wake-Up States
Create active, low-activity, and sleep or standby scenarios. Document content, refresh, brightness, touch and interface state, and host wake time. A product that updates for 5 seconds in every 60-second period should not be modeled as continuously active.
Calculate energy over a representative period:
Ecycle = Pactive × tactive + Pidle × tidle + Pwake × twake
Divide by the period to obtain average power. Record wake-up peaks separately because a short inrush or backlight-start event can affect regulator sizing. If the module requires a power-up order or reset delay, include it in the wake state.
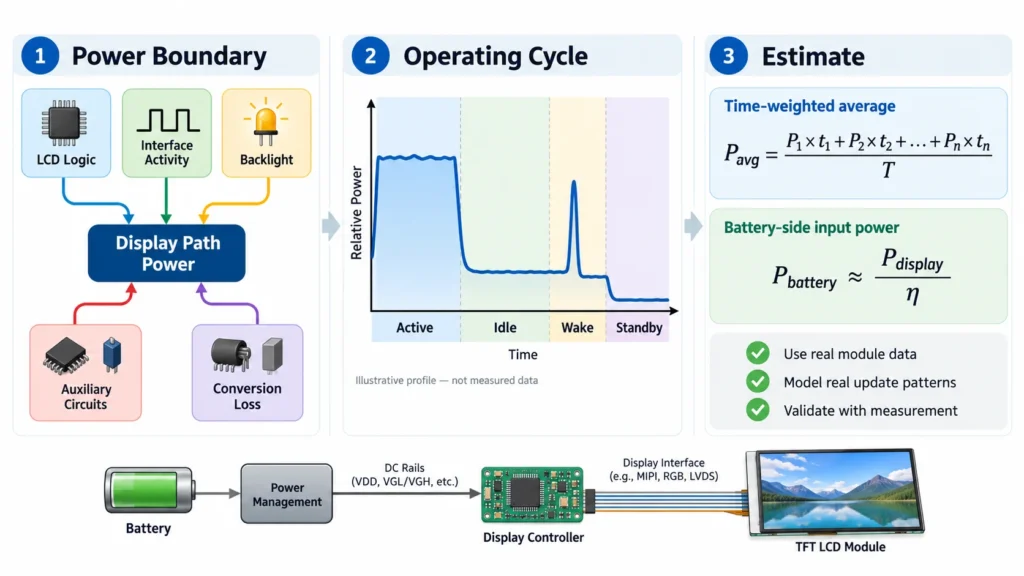
Backlight control often matters more than interface signaling. Compare brightness levels, dimming policy, and screen-on time. Turning the backlight off during low activity may save more energy than changing the link, if the exact module supports it.
Use Real Module Data, Not Interface Assumptions
Product pages narrow candidates but do not replace a configuration-specific power record. Miqidisplay’s 2.8-inch IPS TFT display module lists 240 × 320, a serial MCU interface, and 3.3 V. Its 3.5-inch TFT LCD module lists 320 × 480, an MCU interface, and 3.3 V. These fields start the model; they do not establish interface, backlight, or sleep current.
For broader candidate screening before requesting configuration-specific data, review Miqidisplay’s TFT LCD display module range.
Ask for the exact revision’s current specification and pinout. Confirm whether current is typical, maximum, or measured at stated brightness and timing. Request backlight range, dimming, initialization, standby, touch rails, and cable or bridge losses.
Validate the Estimate with a Measurement Plan
Measure at the module input and battery or converter input. Log power-up, full-frame and partial updates, brightness changes, idle, and wake-up at the intended refresh and representative temperature.
Compare measured energy per cycle with the worksheet. If it differs materially, check backlight duty, host processing, conversion efficiency, refresh activity, and auxiliary functions. Keep typical and worst-case scenarios separate.
Procurement Checklist for a Battery-Powered TFT LCD Module
Before approving a sample, ask the display-module supplier to provide:
- Exact interface, resolution, color depth, timing, and initialization requirements.
- Logic, backlight, touch, and auxiliary rail voltage and current data.
- Typical, maximum, standby, and sleep conditions with their test settings.
- Connector, cable, bridge, backlight-control, and sample-validation details that affect loss or duty cycle.
This turns a broad “low-power display” request into measurable requirements for engineering and purchasing.
Conclusion
To estimate TFT LCD interface power, calculate the complete display path—not just the current associated with a protocol name. Separate logic, interface activity, backlight, auxiliary functions, conversion loss, and transient states. Convert the product’s real update pattern into time-weighted energy, then verify it on the exact module at the intended brightness and timing. This approach makes battery-life estimates more credible and helps the team choose a display module that fits both the electrical architecture and the sourcing plan.
FAQs
Does the interface type determine total TFT LCD power?
No. Interface activity is one component; backlight demand, panel logic, touch, host processing, conversion efficiency, and screen-on time can have a larger effect.
Is SPI always the lowest-power option?
No. SPI may suit low-rate or partial updates, but longer transfers can keep the host active. Compare energy per useful update under the planned workload.
How should battery life be calculated from a module datasheet?
Convert each rail to power, apply active and idle duty cycles, include converter efficiency, and divide usable battery energy by average battery-side power. Check the battery-voltage limits.
What should a supplier confirm before sample approval?
Request the exact revision’s rail currents, backlight range, sleep behavior, timing, initialization, pinout, and test conditions so the model can be checked against a sample.
Request a Miqidisplay Technical Fit Review
Send Miqidisplay the intended display type, diagonal size, outline and active-area dimensions, resolution, interface, color depth, touch requirement, brightness range, viewing direction, operating temperature, screen-on duty cycle, battery voltage, quantity, drawings, and integration environment. With those inputs, contact the Miqidisplay technical team to assess suitable screen or display-module configurations, the information needed for a power estimate, and any customization or sample-documentation requirements that should be verified before approval.
Email: mary@miqidisplay.com
WhatsApp: +86 189 6801 5464